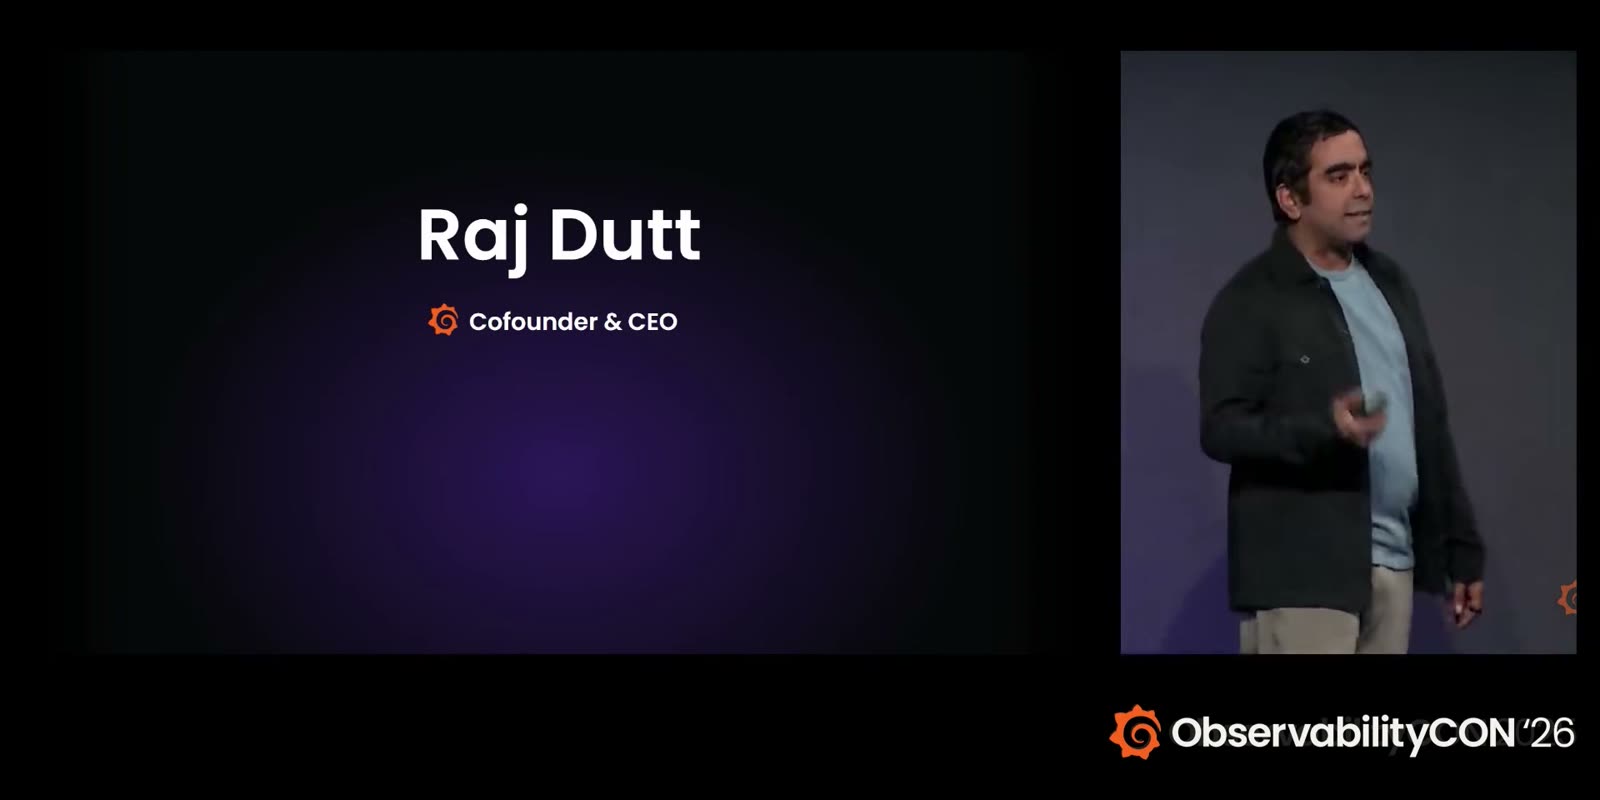
1:15 into the keynote recording. Source: Grafana on YouTube
The company best known for dashboards spent an hour barely talking about dashboards. That’s my takeaway from watching the recording of the ObservabilityCON 2026 keynote, held October 20 at Pier 27 in San Francisco. What held my attention was the demo where an agent investigates an incident and opens a fix PR, and the fact that the instrumentation Grafana builds itself is now built inside OpenTelemetry.
#Agents instead of dashboards
Co-founder Raj Dutt introduced the company with numbers. A remote company of 1,700 people spread across more than 40 countries had passed 10,000 paying customers and $600M in annualized revenue, he said. He spent more time, though, on the claim that we’re at the start of a shift bigger than the mainframe or the cloud.
The edge he pointed to is that Grafana, Prometheus and Loki are open source. The stack runs monitoring at a huge number of companies worldwide, and the internet is full of docs and posts on how to run it. That, in his telling, is why frontier models know this stack better than proprietary vendors’ products. So when Assistant went GA earlier this year, it became a usable tool much faster than they expected, and that surprised even them. Public knowledge is training data. For an open source company in the AI era, I can’t think of a more convincing story, and it matched what I’ve felt contributing to OpenTelemetry recently.
The back half of the keynote was about Assistant taking over the work from watching to fixing. Watchers spend tokens during calibration, then run lightweight checks against the telemetry they selected. Deploy a new feature, let a watcher run for a few weeks, and it learns what normal looks like and alerts you when the feature drifts from it. In Investigations, one agent forms hypotheses while other agents concurrently try to disprove them. The presenter said only that letting the agents fight raises quality. My read is that the design targets a model’s habit of committing to one plausible cause too early. Managed Sandboxes take the investigation’s findings, change the code in your repository and open a PR. In the demo, Assistant stepped into a GitHub CI stage and commented that the PR apparently would break an SLO, and once an incident investigation finished it produced a fix PR from the result. They said they run a loop of their own that prepares a PR every Monday to cut CPU usage at the hotspots profiling found.
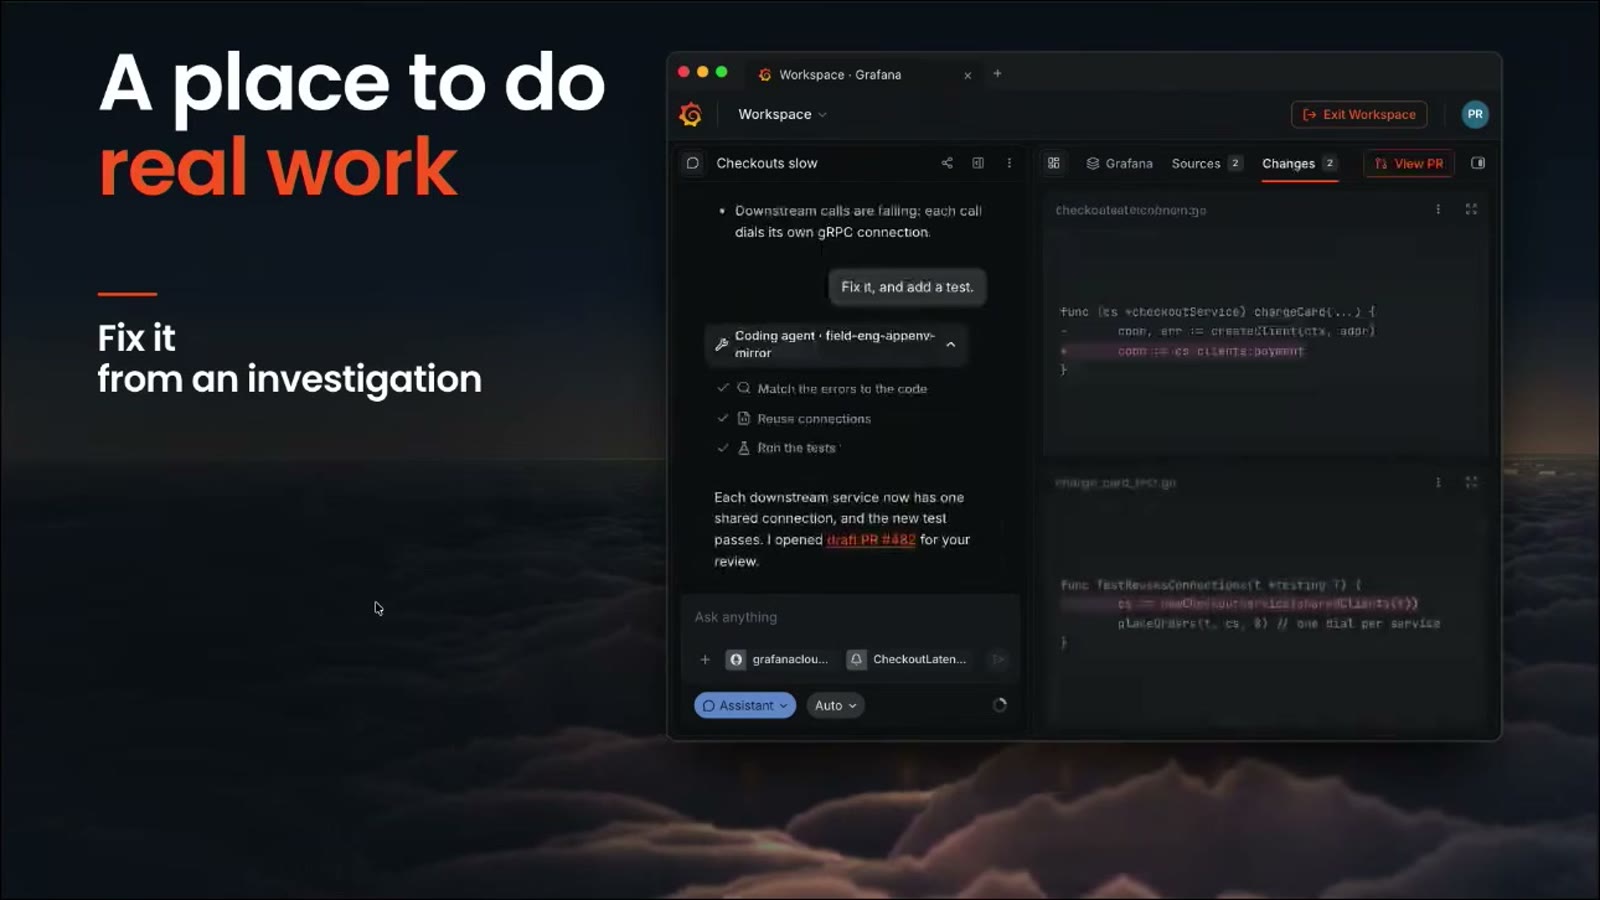
Slide at 49:05 of the keynote recording. Source: Grafana on YouTube
I was more interested in the controls on code changes than in the fixing itself. Each task gets its own MicroVM, and policy decides which networks it can reach, whether it may push branches, and when it creates a PR. Pages, which builds a screen from a single sentence, offers a different safeguard. You can inspect the queries behind its output, and the presenter added that the model can make things up, so trust but verify. The Pages demo had its moment when zooming out wouldn’t work and two people stood there briefly flustered.
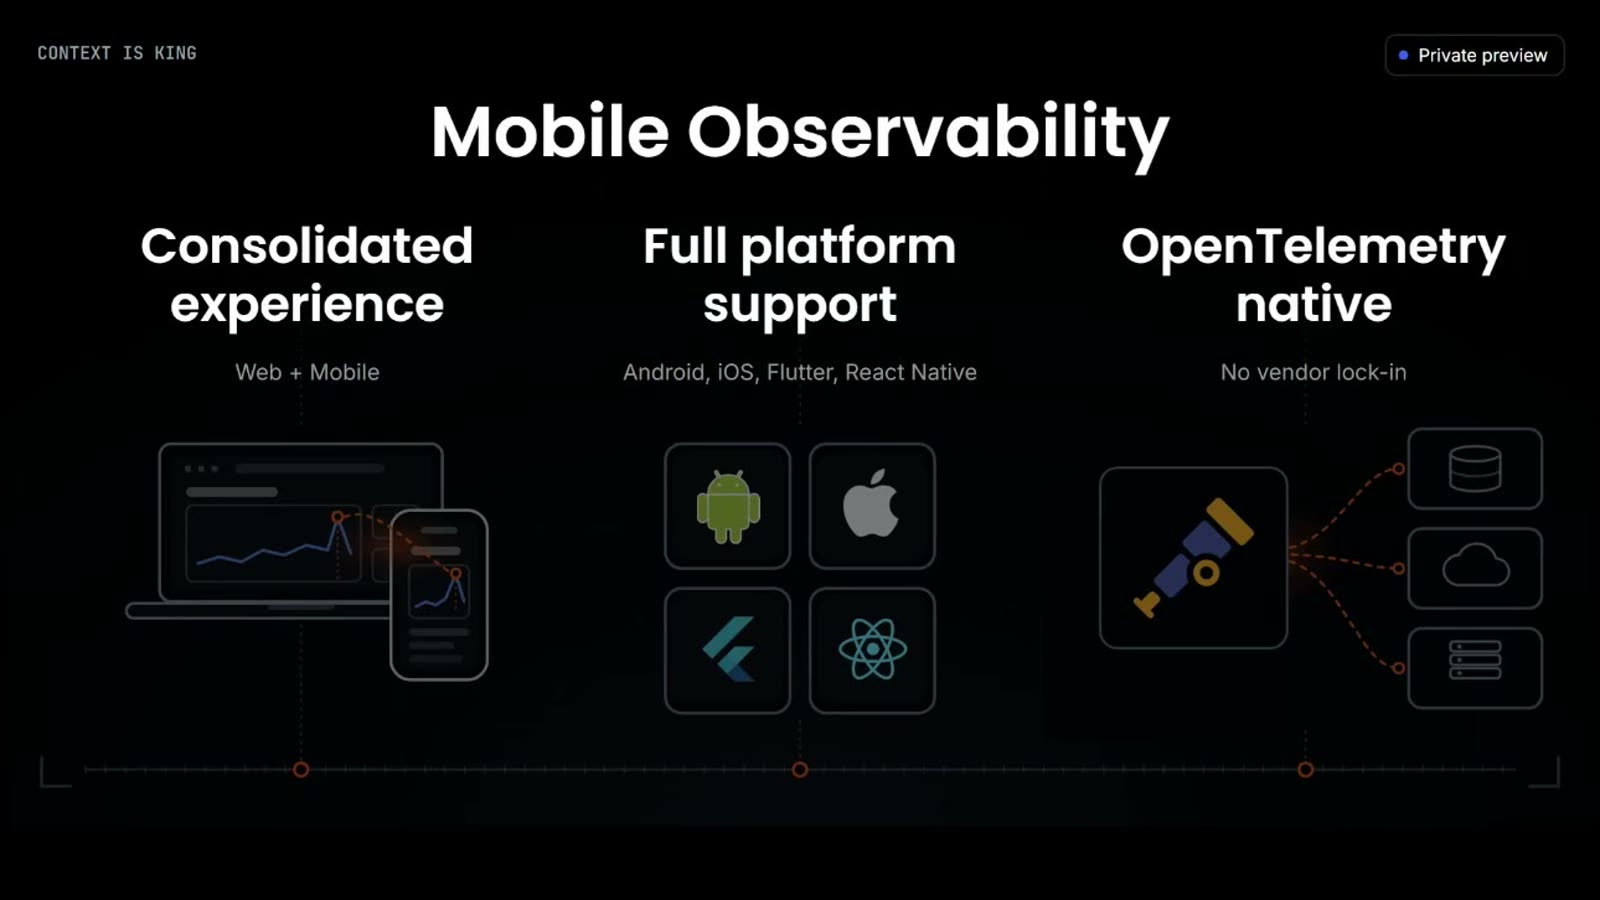
Grafana has accepted OpenTelemetry data for years. The instrumentation announced here is OpenTelemetry on the producing side as well. Agent Observability went GA with OpenTelemetry instrumentation support. This is what the keynote called observability for AI, and the OpenTelemetry GenAI semantic conventions I’ve been working on lately are the spec for exactly this. Instead of a proprietary agent, Mobile Observability adds iOS and Android support directly to the upstream OpenTelemetry SDKs from the start. The presenter who then ran the Android demo also said Grafana is now the second largest contributor to OpenTelemetry. Logs you’d rather not throw away get shipped to your own bucket in OpenTelemetry format too.
Slide at 27:20 of the keynote recording. Source: Grafana on YouTube
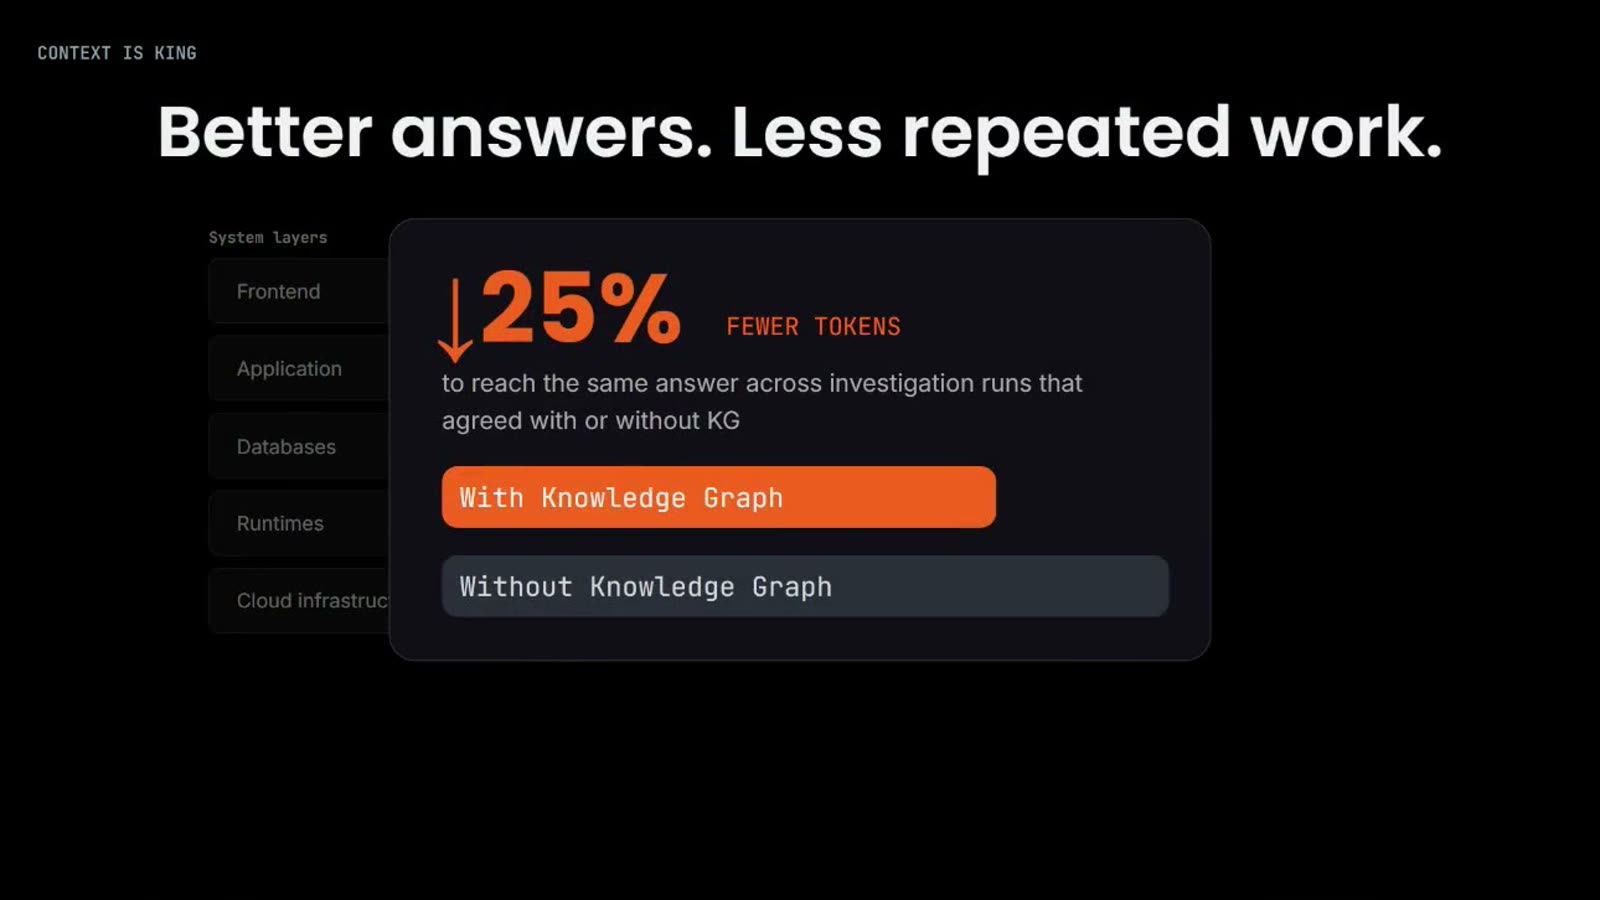
Still, if my team adopts agent operations, the order has to start with context, not PRs. The model knows the software stack but not our architecture, and without context it burns tokens re-deriving the structure on every question. Grafana’s Knowledge Graph is that context. It pulls how infrastructure, runtimes and applications connect out of telemetry, automatically and continuously. The graph is GA, and the gcx CLI and an MCP server let an outside agent like Claude Code read the same graph. The 25% token reduction on the slide comes from Grafana’s own measurement, the median over the pairs that reached the same conclusion out of 553 pairs where an agent with the graph and one without investigated the same alert separately. What we’d check first on our side is whether the service name carries the same value on every signal, and whether calls between services connect in traces. If names disagree, the graph can count one service as two, and if calls break, there’s less ground for tying a metric anomaly and a log error to the same incident. The agent then fills that gap with inference, and a Watcher on a sloppily instrumented system is likely to learn noise rather than normal.
Slide at 22:10 of the keynote recording. Source: Grafana on YouTube
I only run self-managed Grafana, so I checked whether any of this applies to us. The features in this keynote, from Assistant through Watchers and Managed Sandboxes to Pages, need a Grafana Cloud account. You can use Assistant on self-managed Grafana, but it has to connect to a Grafana Cloud stack. Investigations and Grafana Cloud MCP connections stay off in self-managed even with a Cloud stack attached. What self-managed does get is Loki full-text search and the OpenTelemetry SDKs, and they said the Loki side will reach an open source release shortly. For someone who has held out on self-managed, this is the first time there’s a reason to use the cloud. I haven’t used Assistant yet, so this judgment rests on the keynote alone. I plan to verify it with a PoC when I get the chance. The baseline is the record a human left investigating the same incident, and I’ll look at whether it got the cause right and whether the fix PR was mergeable without edits. (We could also build this structure ourselves, of course, inside the agent harness we’ve been putting together.) Either way, the direction is clear. Observability tools are moving from only showing you things to resolving incidents. Grafana starting to open PRs is what that means. And then telemetry is no longer a record you keep. Which telemetry you send becomes the input that decides what the agent changes and how.
#Two announcements outside the main thread
The official guide sorts everything into GA, public preview and private preview, so this section adds just two things the main thread didn’t cover. If you’re short on time, I’d start at 32 minutes into the video.
One is user-side observability, which Grafana files under digital experience monitoring. Frontend Observability grew Session Replay and Critical User Journeys, and Mobile Observability landed next to it in private preview. The presenter said Mobile has been one of their most requested features.
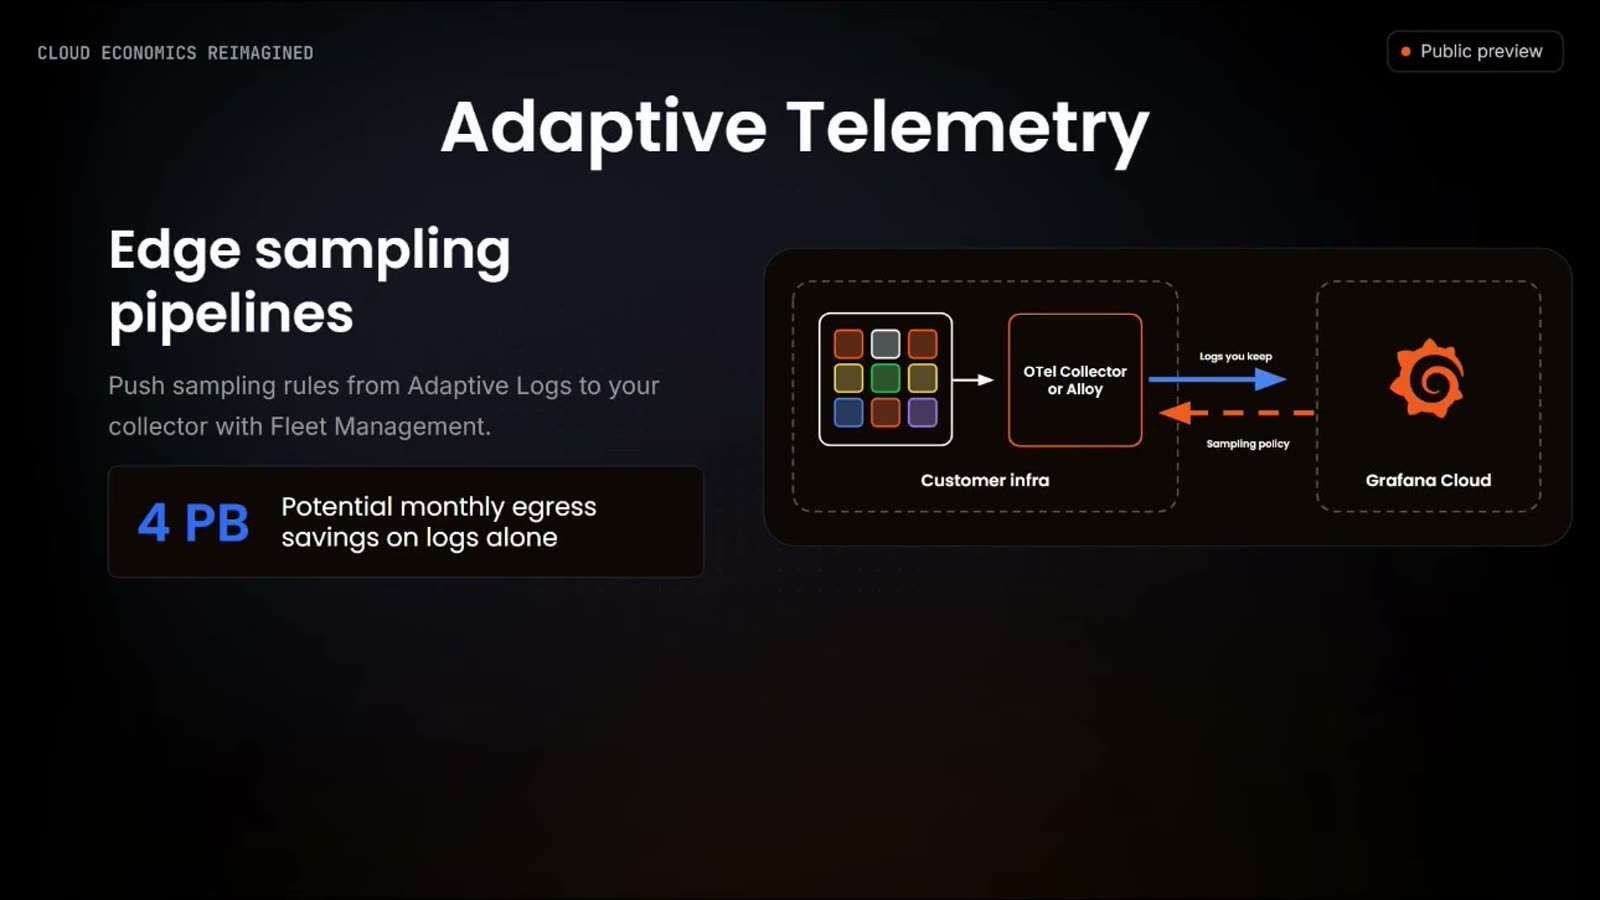
The other is cost, and the message was that they’d absorb the telemetry explosion with technology rather than price. The evidence was running entire regions inside the customer’s cloud account, a bare-metal cluster being built in Ireland, and Mimir’s 10 billion active series, up tenfold in a year. Loki full-text search went GA on indexing technology they acquired in April, with average queries 5x faster and 75% less data scanned, they said. That it comes at no additional cost is in the official guide. Sampling policies get pushed down to Alloy and OpenTelemetry collectors so data you’d drop is dropped before it’s sent. For now that applies to logs only, with other signals to follow, they said.
Slide at 17:10 of the keynote recording. Source: Grafana on YouTube
The event is still underway in US time. Once the session recordings are up, I’ll go through them and add the ones worth watching here.
#References
- ObservabilityCON 2026 Keynote (YouTube, Grafana). The one-hour keynote in which eight presenters, Raj Dutt and Tom Wilkie among them, walk through cloud economics, context, agent operations and Pages in turn.
- ObservabilityCON 2026: A guide to all the announcements from Grafana Labs. The official guide that sorts the announced features into GA, public preview and private preview.
- Grafana Labs Charts the Path to Agentic Operations (press release, Oct 20, 2026). The press release announcing OpenTelemetry support in Agent Observability, Watchers going GA, and the public previews of Pages and Managed Sandboxes.
- Grafana Assistant for self-managed Grafana. The official doc on what it takes to use Assistant on self-managed Grafana.
- Why observability is the key to trusting your AI agents. The session that treats agent sessions as a signal to view alongside metrics, logs, traces and profiles. Worth watching right after the keynote once the recording is up.